-
 Iftach Sadeh authoredIftach Sadeh authored
Early Detection of Multiwavelength Blazar Variability
Code and dataset for our paper Early Detection of Multiwavelength Blazar Variability (also avaiable at arXiv:2411.10140).
Abstract
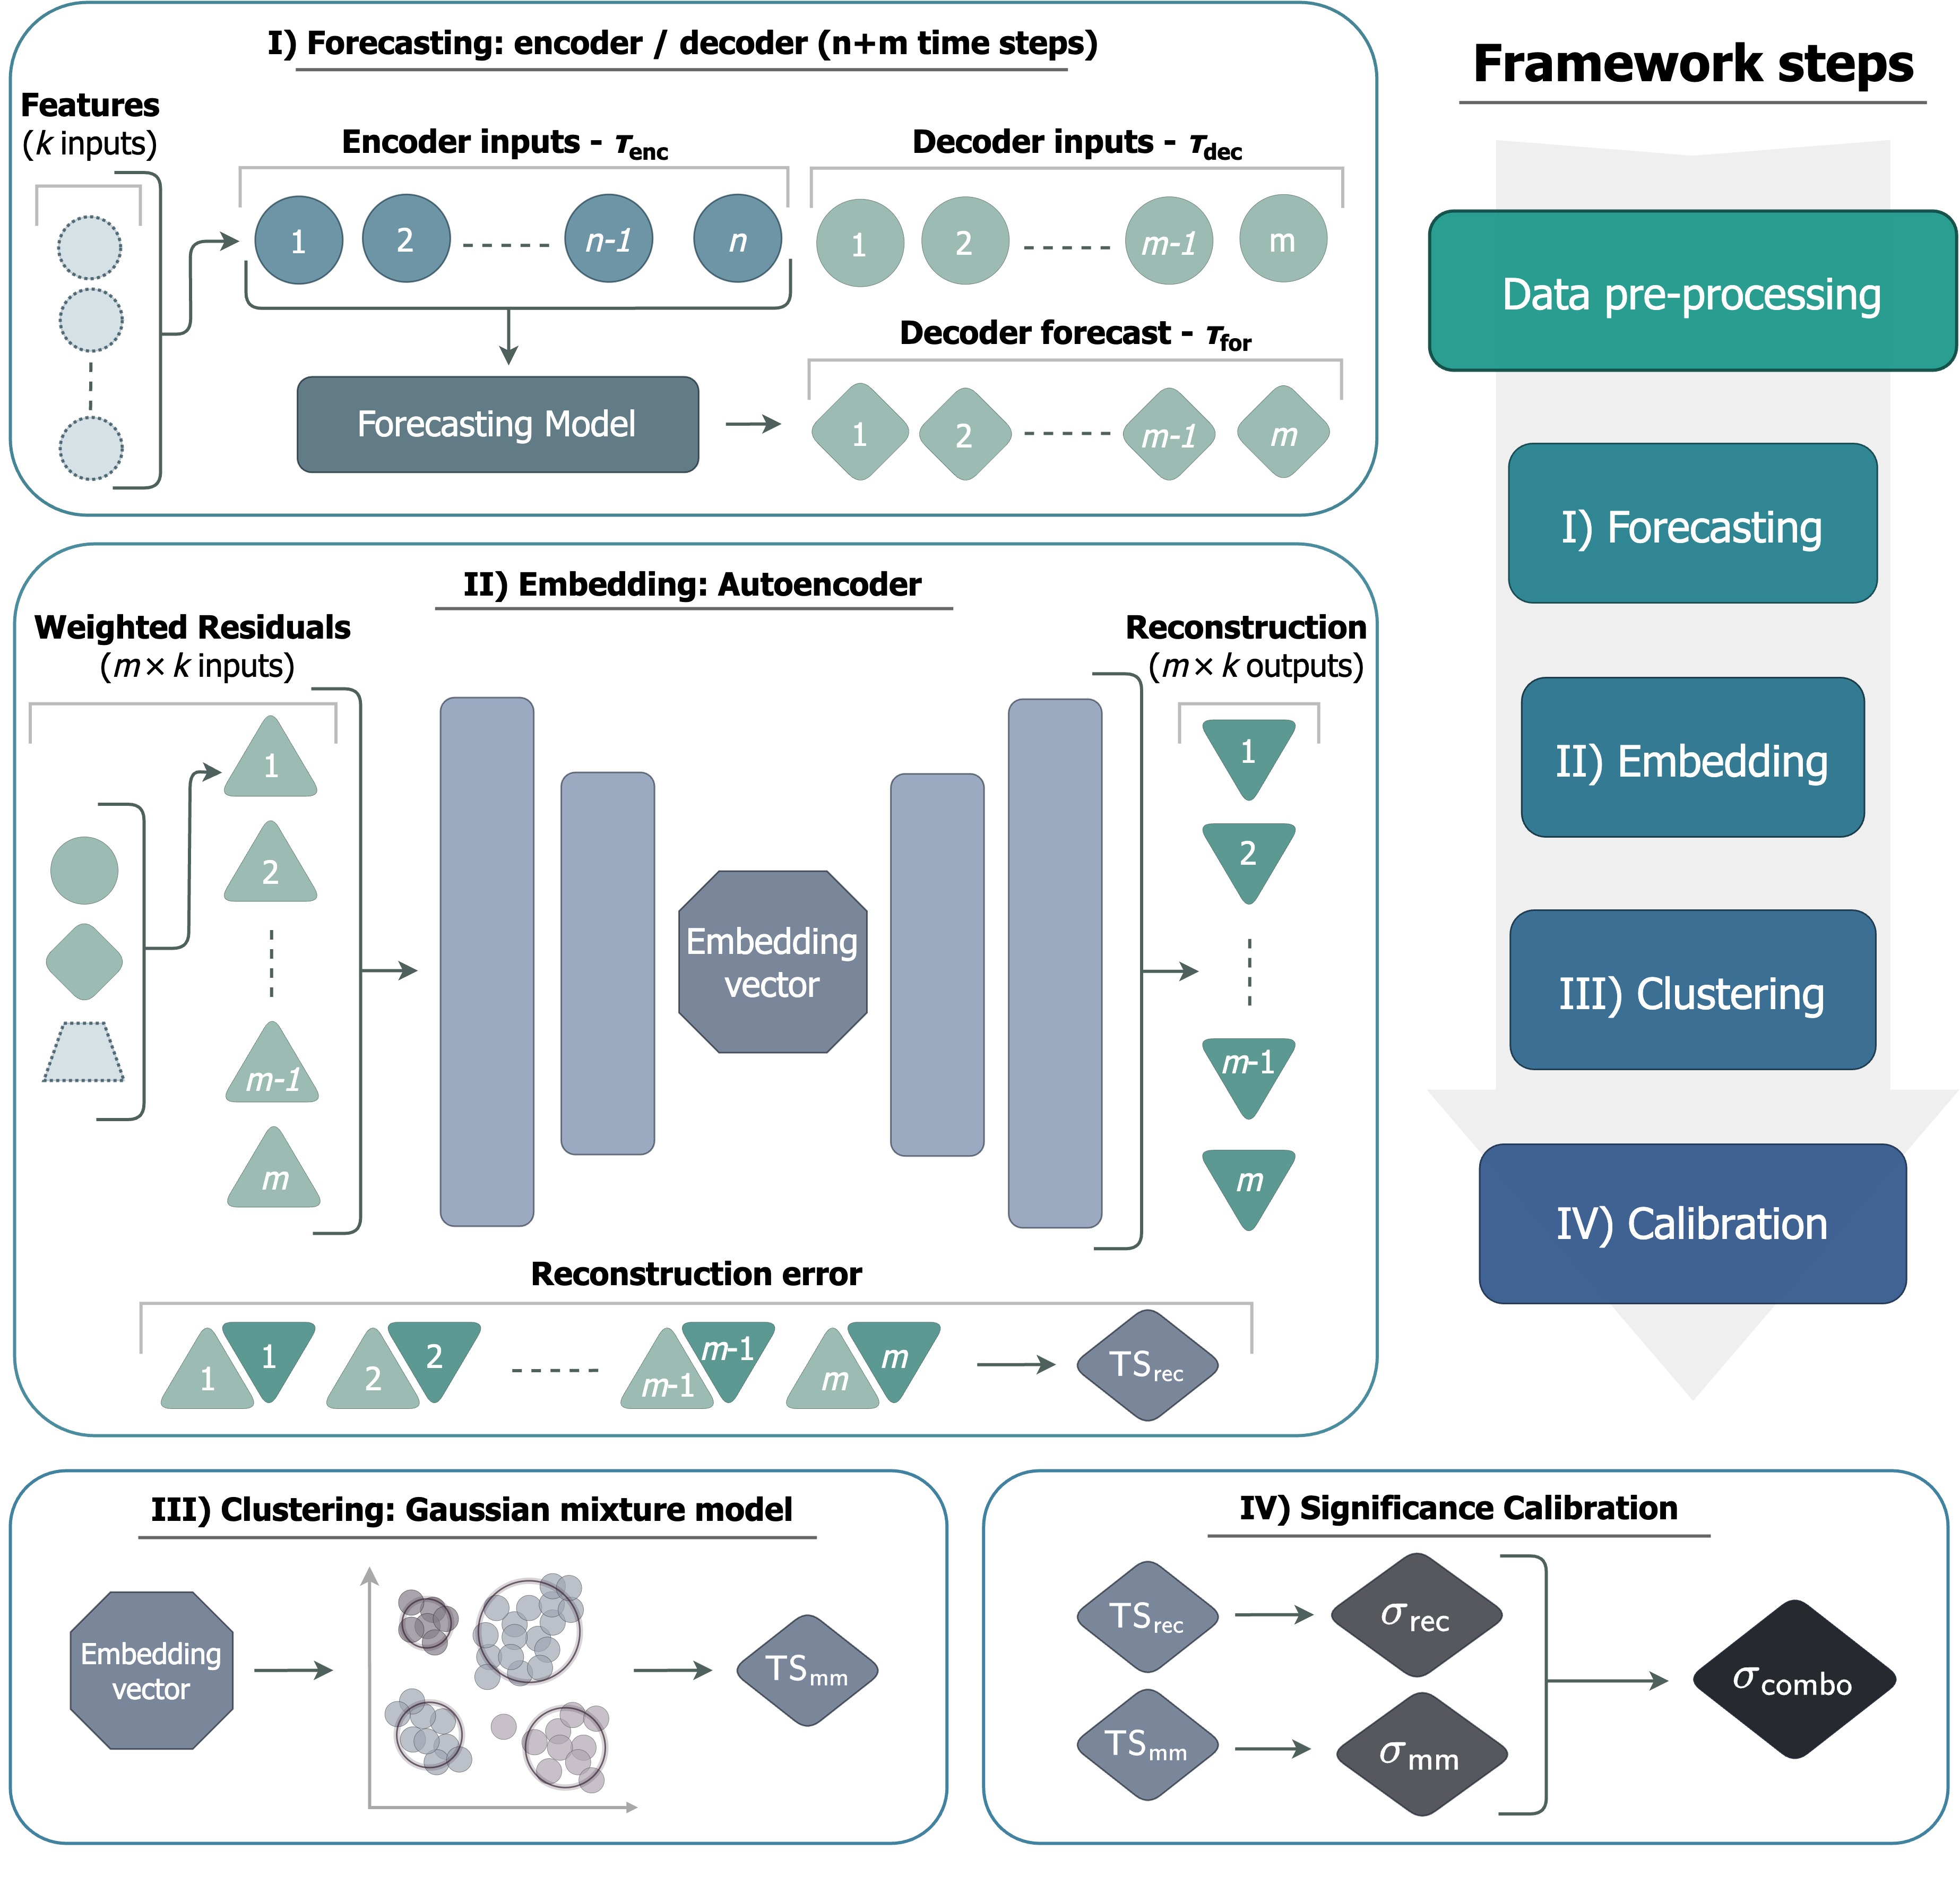
Blazars are a subclass of active galactic nuclei (AGNs) with relativistic jets pointing toward the observer. They are notable for their flux variability at all observed wavelengths and timescales. Together with simultaneous measurements at lower energies, the very-high-energy (VHE) emission observed during blazar flares may be used to probe the population of accelerated particles. However, optimally triggering observations of blazar high states can be challenging. Notable examples include identifying a flaring episode in real time and predicting VHE flaring activity based on lower energy observables. For this purpose, we have developed a novel deep learning analysis framework, based on data-driven anomaly detection techniques. It is capable of detecting various types of anomalies in real-world, multiwavelength light curves, ranging from clear high states to subtle correlations across bands. Based on unsupervised anomaly detection and clustering methods, we differentiate source variability from noisy background activity, without the need for a labeled training dataset of flaring states. The framework incorporates measurement uncertainties and is robust given data quality challenges, such as varying cadences and observational gaps. We evaluate our approach using both historical data and simulations of blazar light curves in two energy bands, corresponding to sources observable with the Fermi Large Area Telescope, and the upcoming Cherenkov Telescope Array Observatory (CTAO). In a statistical analysis, we show that our framework can reliably detect known historical flares.
Setup
In the following, we are providing necessary setup steps as well as instructions on how to reproduce the experiments from our paper. All steps have been tested under macOS Sequoia 15.0.
Step 1: Clone Repostiroy and Create Python Environment
Using conda, create a python environment as follows: conda create -n blazar_variability python=3.8 pytables=3.7.0
Below we assume the repository has been cloned into the directory repo_dir.
Step 2: Install Python Requirements
- Using a virtual environment is suggested, e.g.
conda activate blazar_variability - Initializing the environment, running the experiments and recreating the figures requires additional python packages. To install the python requirements automatically, from
repo_dir, run one of the following commands:
# Dependencies (Running Experiments and Plotting)
pip install -r requirements_osxm1.txt
Step 3: Download dataset
While the BL LAC dataset cannot be published at the time of publication due to its proprietary nature,
we make the simulation dataset publically available.
To obtain the simulation dataset, download the archive from Zenodo,
decompress it, and place the bf_simulations folder inside {repo_dir}/input/flares.
Running Experiments
Automatic Reproduction of the Paper's Experiments and Plots
To run the model training, inference and plotting and thus reproduce all figures, run the pipeline, run (from repo_dir):
python ./src/trans_finder/flares/main.py --config_path=src/trans_finder/flares/run_confs/simulations.ymlTo run selected stages of the pipeline and to customize its parameters, consult the used configuration file at src/trans_finder/flares/run_confs/simulations.yml.
In particular, the first part that is shown below allows to customize which stages will be executed. Note that the
downloaded simulation dataset already includes the preprocessed data, which is why the prep_train stage for
training data preprocessing and augmentation is disabled by default.
pipeline_flow:
#  - [ prep_train, { } ] # data preprocessing and training data augmentation
  - [ train, { only_do_train_scale: true } ] # input normalization on background cut
  - [ train, { train_phases: [0] } ] # train forecasting on background cut
  - [ train, { train_phases: [1] } ] # train reconstruction on full dataset
  - [ bgmm_fit, { } ] # fit mixture model to background cut data
  - [ calib, { } ] # calibrate negative mixture model probability into p_value
  - [ predict, { } ] # inference and plotting results
  - [ create_custom_realisations, { } ] # preprocess data for systematic evaluation of historical flares
  - [ predict, # inference and plotting of historical flares
    { dir_input_predict: custom_realisations,
      dir_output_predict: predict_out_custom_realisations } ]
Results are stored in the within the folder output/flares.
Jupyter Notebook: The repository includes a jupyter notebook, named bf_simulations.ipynb, which consolidates all reproduced figures into a single document.
It provides a mapping of Figure numbers from the paper to output file paths.
The pipeline stages print debugging information that is usually safe to ignore, as long as the figures are generated successfully.
Citation
If this work is helpful, please cite as:
@misc{stolte2024earlydetectionmultiwavelengthblazar,
      title={Early Detection of Multiwavelength Blazar Variability},
      author={Hermann Stolte and Jonas Sinapius and Iftach Sadeh and Elisa Pueschel and Matthias Weidlich and David Berge},
      year={2024},
      eprint={2411.10140},
      archivePrefix={arXiv},
      primaryClass={astro-ph.HE},
      url={https://arxiv.org/abs/2411.10140},
}
Acknowledgments
We would like to thank the following people for numerous useful discussions: Q. Feng, M. Gurwell, C. McGrath, M. Negro, D. Parsons, and B. Rani. We would also like to thank the CTAO consortium and the Fermi-LAT and VERITAS collaborations for conducting internal courtesy reviews, and for providing useful feedback on this work. This work is supported by the Helmholtz Einstein International Berlin Research School in Data Science (HEIBRiDS). This work made use of data supplied by the UK Swift Science Data Centre at the University of Leicester. This research made use of the NASA/IPAC Infrared Science Archive, which is funded by the National Aeronautics and Space Administration and operated by the California Institute of Technology. This research made use of observations from the Submillimeter Array, a joint project between the Smithsonian Astrophysical Observatory and the Academia Sinica Institute of Astronomy and Astrophysics, funded by the Smithsonian Institution and the Academia Sinica. We recognize that Maunakea is a culturally important site for the indigenous Hawaiian people; we are privileged to study the cosmos from its summit. This research has made use of the VizieR catalog access tool, CDS, Strasbourg, France (F. Ochsenbein 1996). The original description of the VizieR service was published in F. Ochsenbein et al. (2000). This research made use of observations obtained with the 48inch Samuel Oschin Telescope and the 60 inch Telescope at the Palomar Observatory as part of the Zwicky Transient Facility project. ZTF is supported by the National Science Foundation under grant Nos. AST-1440341 and AST-2034437, and a collaboration including current partners Caltech, IPAC, the Oskar Klein Center at Stockholm University, the University of Maryland, University of California, Berkeley, the University of Wisconsin at Milwaukee, University of Warwick, Ruhr University, Cornell University, Northwestern University, and Drexel University. Operations are conducted by COO, IPAC, and UW. The Fermi-LAT Collaboration acknowledges generous ongoing support from a number of agencies and institutes that have supported both the development and the operation of the LAT as well as scientific data analysis. These include the National Aeronautics and Space Administration and the Department of Energy in the United States, the Commissariat à l’Energie Atomique and the Centre National de la Recherche Scientifique/Institut National de Physique Nucléaire et de Physique des Particules in France, the Agenzia Spaziale Italiana and the Istituto Nazionale di Fisica Nucleare in Italy, the Ministry of Education, Culture, Sports, Science and Technology (MEXT), High Energy Accelerator Research Organization (KEK) and Japan Aerospace Exploration Agency (JAXA) in Japan, and the K. A. Wallenberg Foundation, the Swedish Research Council and the Swedish National Space Board in Sweden. Additional support for science analysis during the operations phase is gratefully acknowledged from the Istituto Nazionale di Astrofisica in Italy and the Centre National d’Études Spatiales in France. This work was performed in part under DOE Contract DE-AC02-76SF00515. The authors thank the VERITAS collaboration for making available the data used in this publication. This research made use of the CTAO instrument response functions; see https://www.cta-observatory.org/science/ctaperformance/ for more details.
Facilities: CTAO, Fermi-LAT, SMA, Swift-XRT, Tuorla, PTF, ZTF, IRSA, VERITAS